002-Commodity Proportions by Vehicle Numbers and Estimated Tonnage.002-R23-Volksrust-Standerton
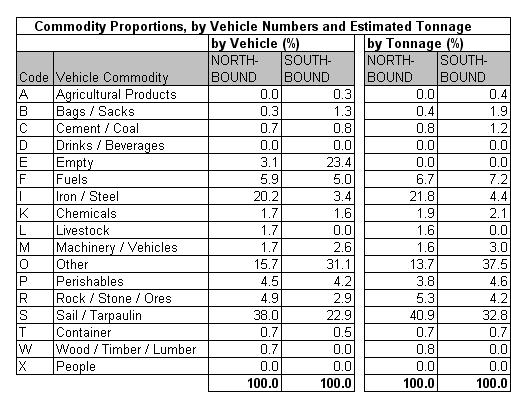
Table 2.4a
|
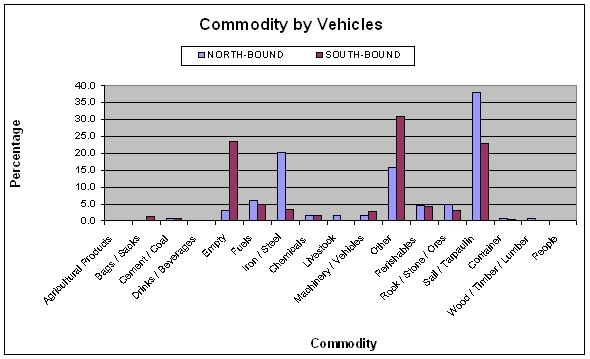
Table 2.4b
|
Table 2.4c
|
The commodity analysis showed that 3% of northbound and
23% of southbound vehicles was empty. The main
identifiable commodity by vehicle was iron/steel (20%) in
the northbound direction. Unidentified cargo comprising
other and under sail/tarpaulin totaling 54% of all
vehicles surveyed.
|


