004-Commodity Proportions by Vehicle Numbers and Estimated Tonnage.004-N11-Newcastle-Ladysmith
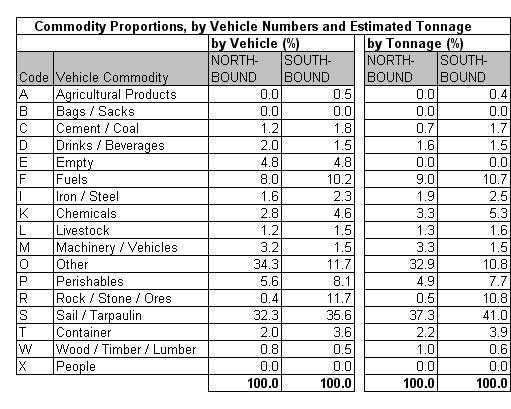
Table 4.4a
|
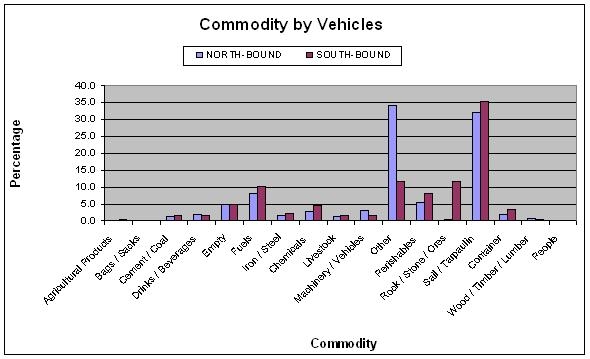
Table 4.4b
|
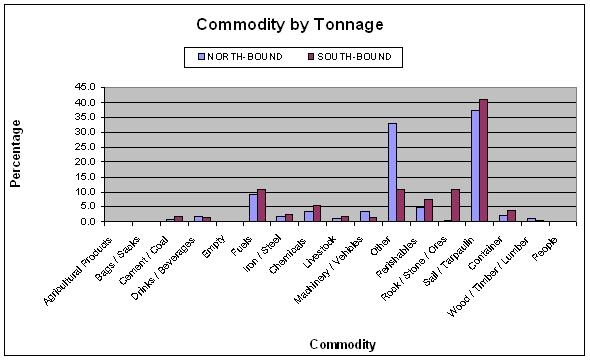
Table 4.4c
|
The commodity analysis showed that 5% of all vehicles were
empty. No identifiable commodity dominates. Unidentified
cargo comprising other and under sail/tarpaulin totaling
67% of northbound and 47% of southbound vehicles surveyed.
|


