005-Commodity Proportions by Vehicle Numbers and Estimated Tonnage.005-R103-Ladysmith-Durban
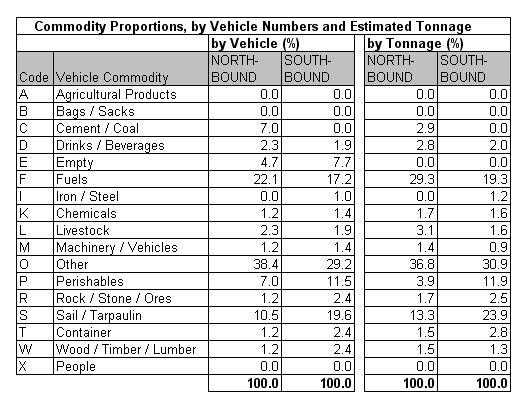
Table 5.4a
|
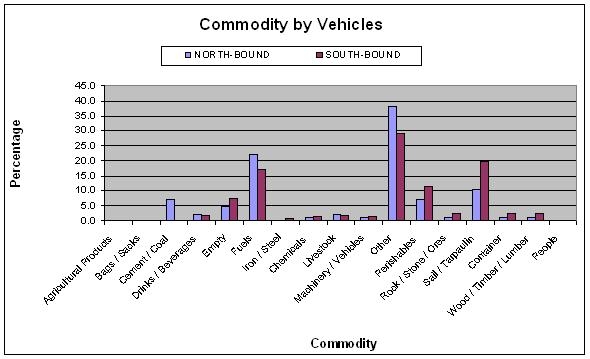
Table 5.4b
|
Table 5.4c
|
The commodity analysis showed that about 5% of northbound
and 8% of southbound vehicles were empty. The main
identifiable commodity by vehicle was fuels (20%).
Unidentified cargo comprising other and under
sail/tarpaulin totaling 49% of all vehicles surveyed.
|


