006-Commodity Proportions by Vehicle Numbers and Estimated Tonnage.006-R103-Ladysmith-Harrismith
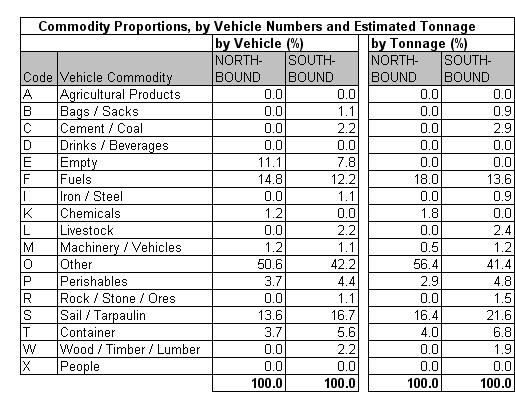
Table 6.4a
|
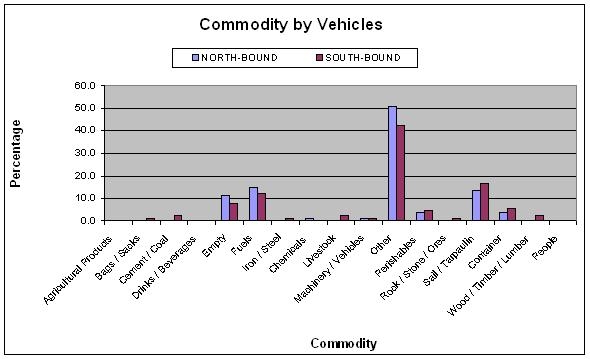
Table 6.4b
|
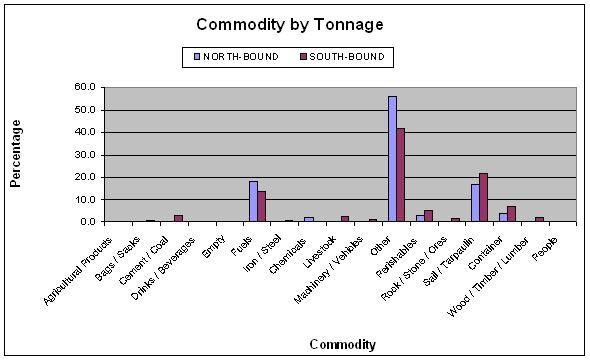
Table 6.4c
|
The commodity analysis showed that about 11% of northbound
and 8% of southbound vehicles were empty. The highest
identifiable commodity by vehicle was fuel. Unidentified
cargo comprising other and under sail/tarpaulin totaled
61% of all vehicles surveyed.
|


