008-Commodity Proportions by Vehicle Numbers and Estimated Tonnage.008-R103-Howick-Nothingham
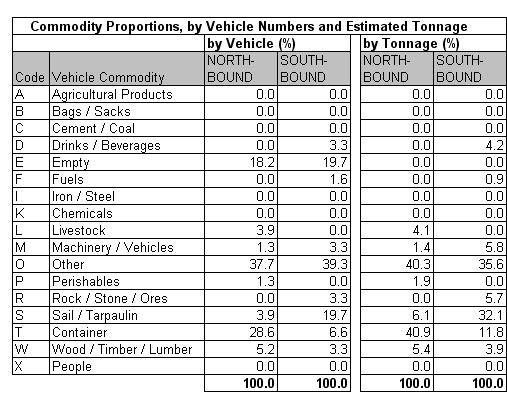
Table 8.4a
|
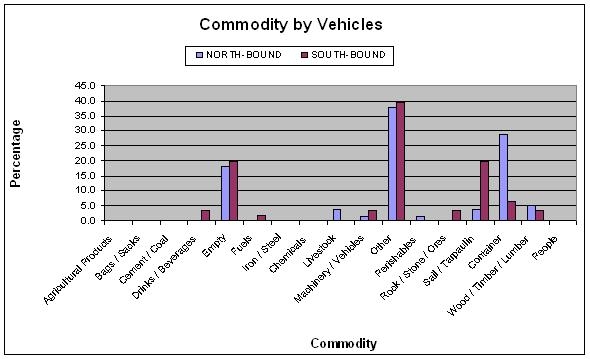
Table 8.4b
|
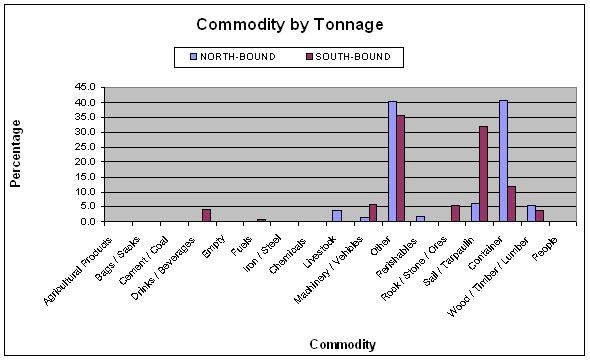
Table 8.4c
|
The commodity analysis showed that 19% of vehicles were
empty. The dominant identifiable commodity by vehicle was
containers in the northbound direction. Unidentified cargo
comprising other (38% northbound and 39% southbound) and
under sail/tarpaulin (29% northbound and 7% southbound).
|


