009-Commodity Proportions by Vehicle Numbers and Estimated Tonnage.009-R103-Mooiriver-Escourt
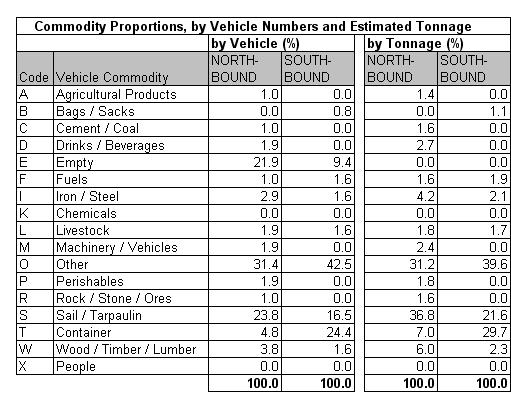
Table 9.4a
|
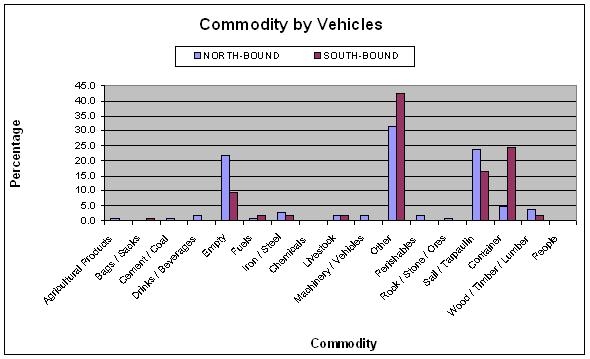
Table 9.4b
|
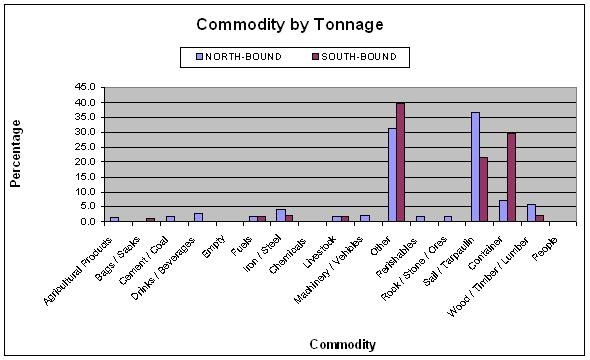
Table 9.4c
|
The commodity analysis showed that 22% of northbound and
9% of southbound vehicles was empty. The dominant
identifiable commodity by vehicle was containers in the
southbound direction. Unidentified cargo comprising other
and under sail/tarpaulin total 57% of the total.
|


