010- Commodity Proportions by Vehicle Numbers and Estimated Tonnage.010-R602-N11-Dundee
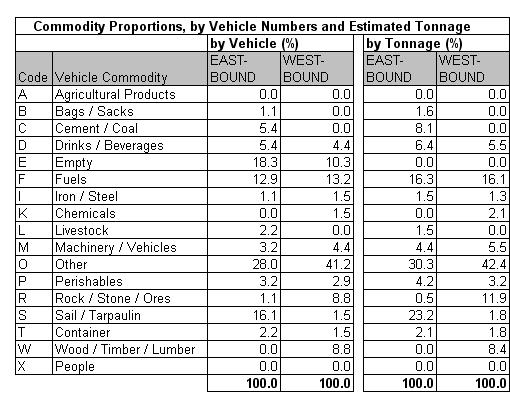
Table 10.4a
|
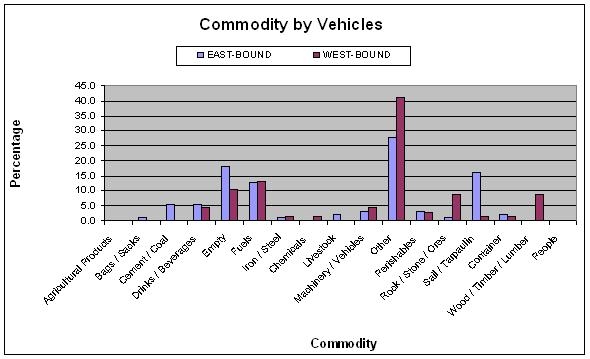
Table 10.4b
|
Table 10.4c
|
The commodity analysis showed that about 14% of vehicles
were empty. The main identifiable commodities by vehicle
were fuels. Unidentified cargo comprising other and under
sail/tarpaulin was 44% of the total.
|


