 |
011-Commodity Proportions by Vehicle Numbers and Estimated Tonnage.011-R74-N3-Bergville
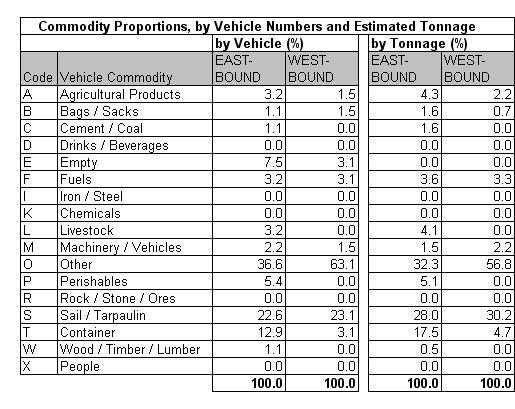
Table 11.4a
|
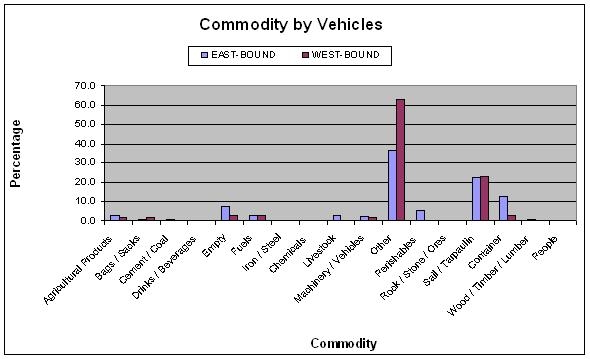
Table 11.4b
|
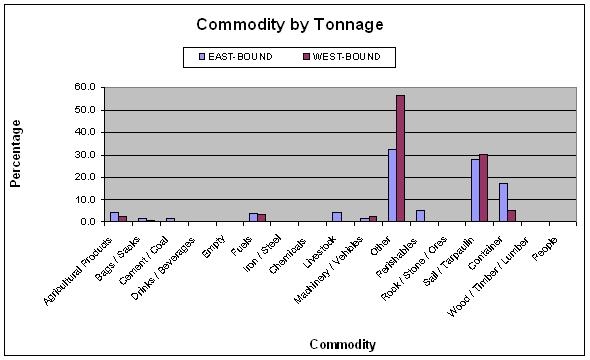
Table 11.4c
|
The commodity analysis showed that about 5% of vehicles
were empty. Of the identifiable commodities by vehicle, no
commodity dominates. Unidentified cargo comprising other
and under sail/tarpaulin totaled 72% of all vehicles
surveyed.
|
|


