 |
012-Commodity Proportions by Vehicle Numbers and Estimated Tonnage.012-R74-N3-Colenso
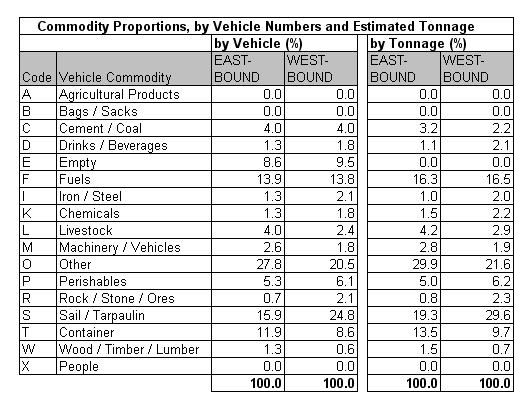
Table 12.4a
|
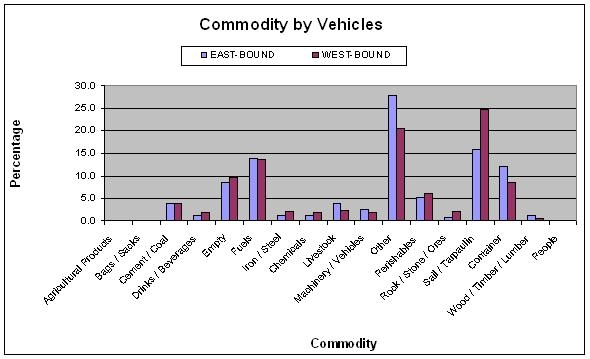
Table 12.4b
|
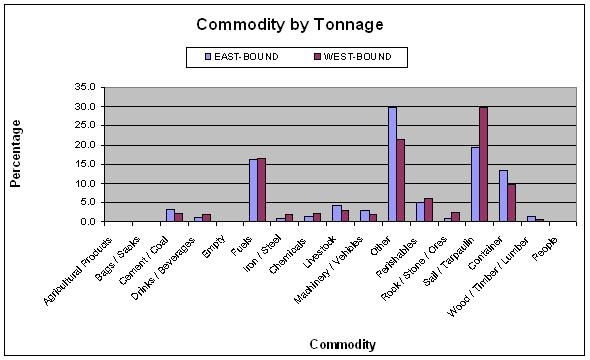
Table 12.4c
|
The commodity analysis showed that about 9% of vehicles
were empty. Of the identifiable commodities by vehicle,
fuels (14%) and containers (10%) were the highest recorded.
Unidentified cargo comprising other and under
sail/tarpaulin totaling 45% of all vehicles surveyed.
|
|


