013-Commodity Proportions by Vehicle Numbers and Estimated Tonnage.013-N3-Mariannhill-Pietermaritzburg
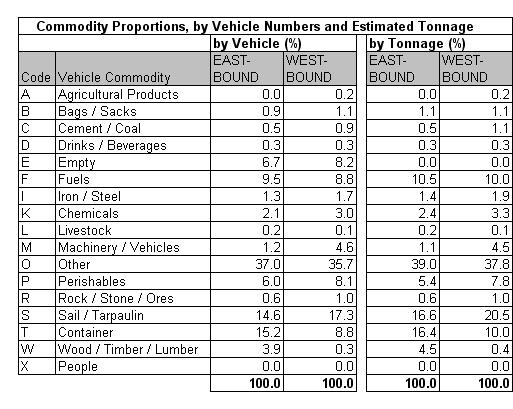
Table 13.4a
|
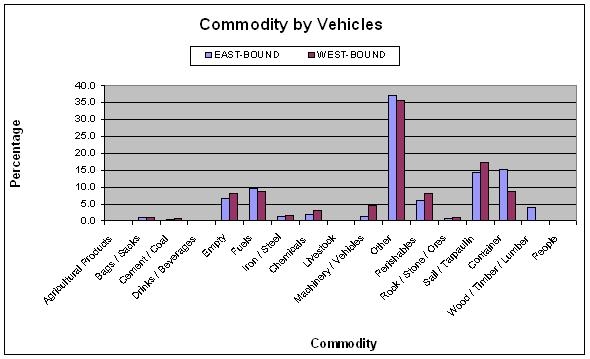
Table 13.4b
|
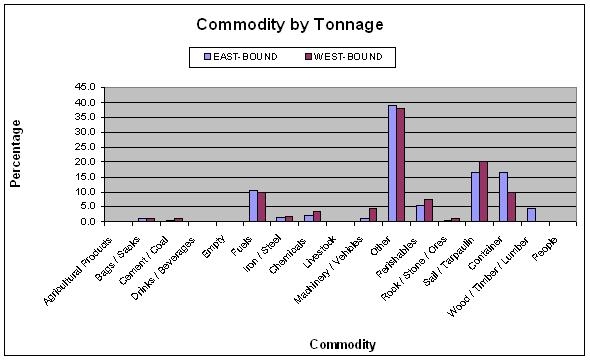
Table 13.4c
|
The commodity analysis showed that about 7% of vehicles
were empty. The main identifiable commodities were
containers (12%), fuels (9%) and perishables (7%).
Unidentified cargo comprising other and under
sail/tarpaulin totaled 53% of all vehicles surveyed.
|


