017-Commodity Proportions by Vehicle Numbers and Estimated Tonnage.017-R66-Magudu-Pongola
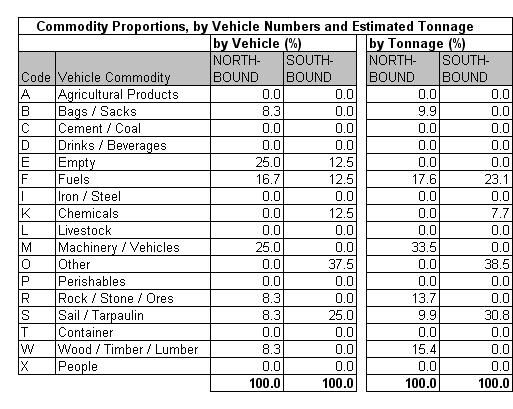
Table 17.4a
|
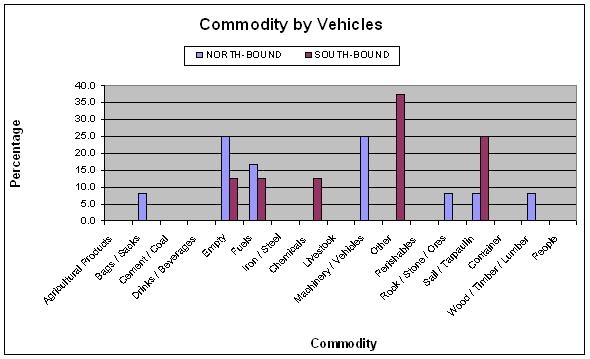
Table 17.4b
|
Table 17.4c
|
The commodity analysis showed that about 25% of northbound
and 13% of southbound vehicles were empty. The main
identifiable commodities were fuel and machinery/vehicles
(northbound). Unidentified cargo comprising other and
under sail/tarpaulin totaling 63% of southbound vehicles
surveyed.
|


