019-Commodity Proportions by Vehicle Numbers and Estimated Tonnage. 019-R66-Nkwalini-Gingindlovu
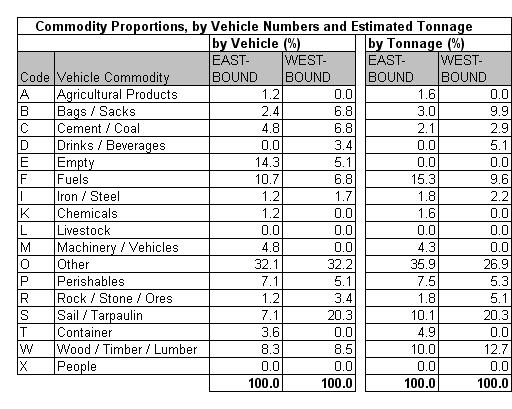
Table 19.4a
|
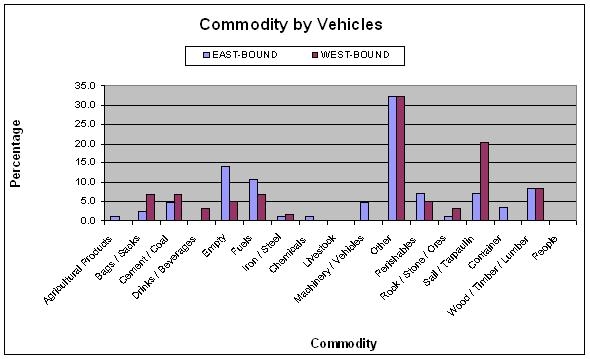
Table 19.4b
|
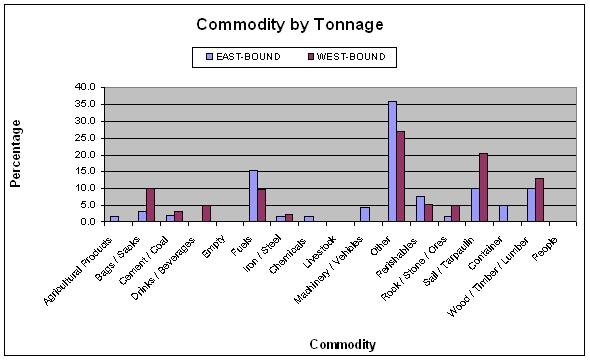
Table 19.4c
|
The commodity analysis showed that about 14% of eastbound
and 5% of westbound vehicles were empty. No identifiable
commodity dominates. Unidentified cargo comprising other
and under sail/tarpaulin was 46% of the total.
|


