020-Commodity Proportions by Vehicle Numbers and Estimated Tonnage.020-R34-Nkwalini-Empangeni
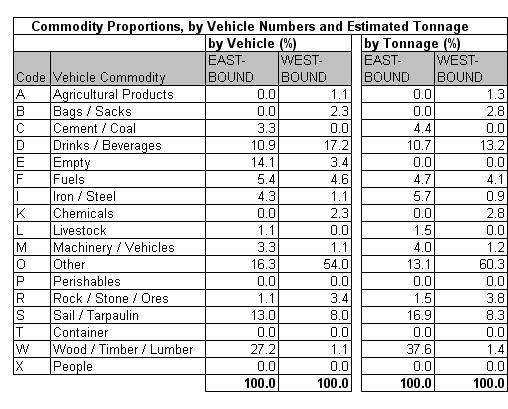
Table 20.4a
|
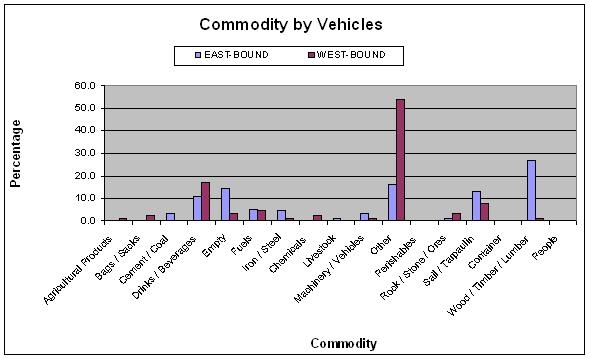
Table 20.4b
|
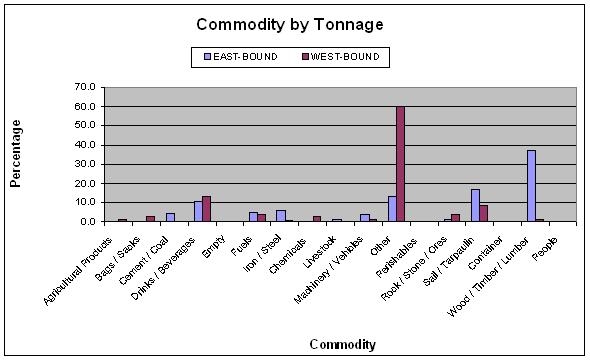
Table 20.4c
|
The commodity analysis showed that about 14% of eastbound
and 3% of westbound vehicles were empty. No identifiable
commodity dominates. Unidentified cargo comprising other
(16% eastbound and 54% westbound) and under sail/tarpaulin
(13% eastbound and 8% westbound).
|


