024- Commodity Proportions by Vehicle Numbers and Estimated Tonnage.024-M53-Umkomaas-N2
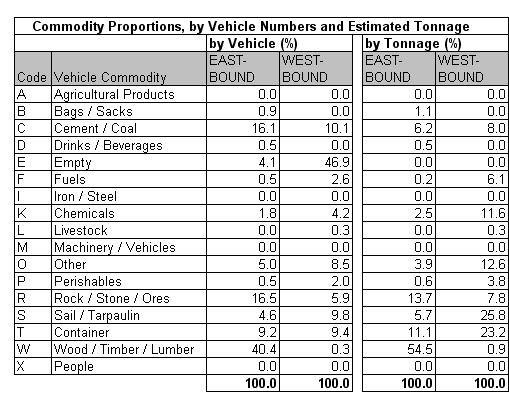
Table 24.4a
|
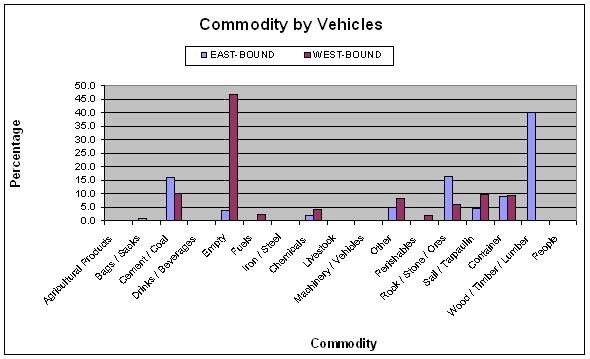
Table 24.4b
|
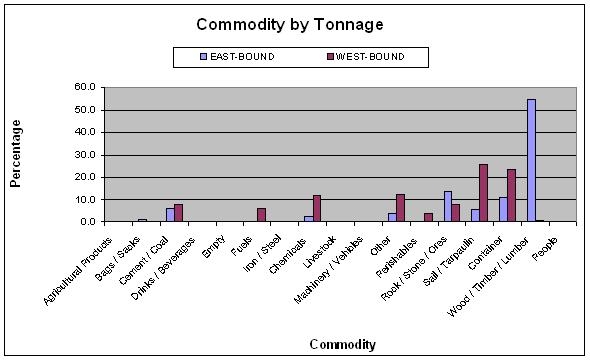
Table 24.4c
|
The commodity analysis showed that about 4% of eastbound
and 47% of westbound vehicles were empty. The main
identifiable commodity was timber in the eastbound
direction. Unidentified cargo comprising other and under
sail/tarpaulin totaling 14% of all vehicles surveyed.
|


