025-Commodity Proportions by Vehicle Numbers and Estimated Tonnage.025-R102-Empangeni-Mtunzini
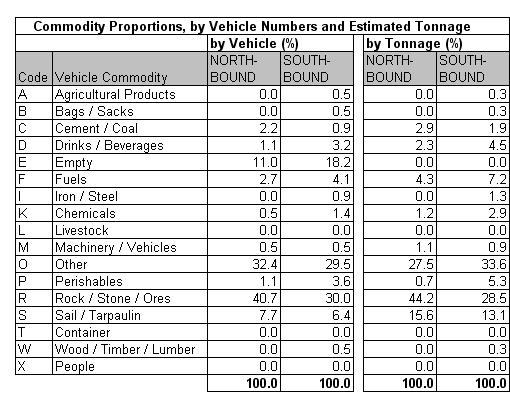
Table 25.4a
|

Table 25.4b
|
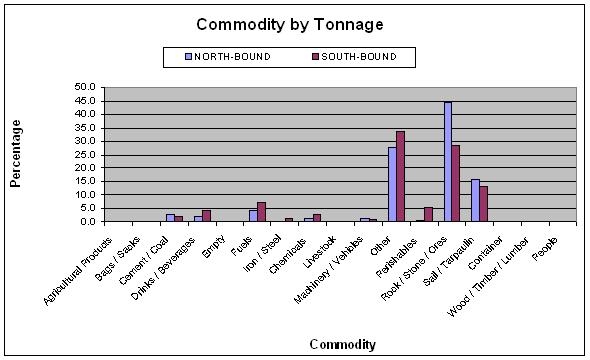
Table 25.4c
|
The commodity analysis showed that about 11% of northbound
and 18% of southbound vehicles were empty. The main
identifiable commodity by vehicle was stone/rock/ore.
Unidentified cargo comprising other and under
sail/tarpaulin was 38% of the total.
|


