027-Commodity Proportions by Vehicle Numbers and Estimated Tonnage.027-N2-Park Rynie-Port Shepstone
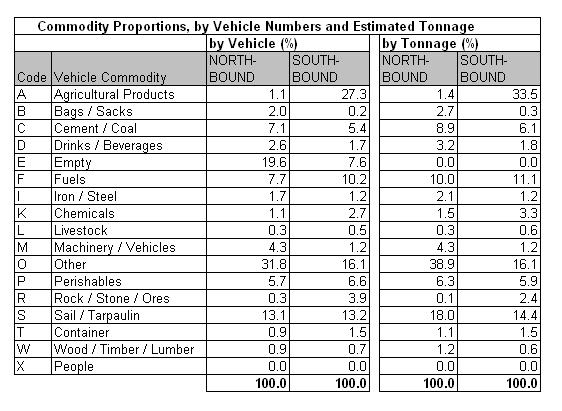
Table 27.4a
|
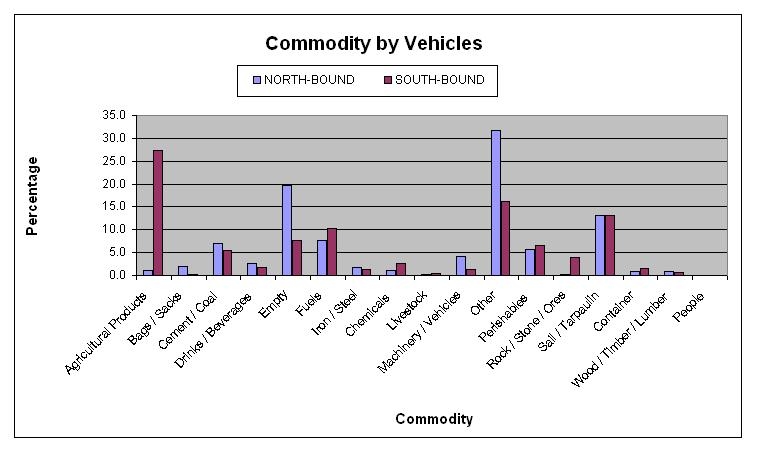
Table 27.4b
|
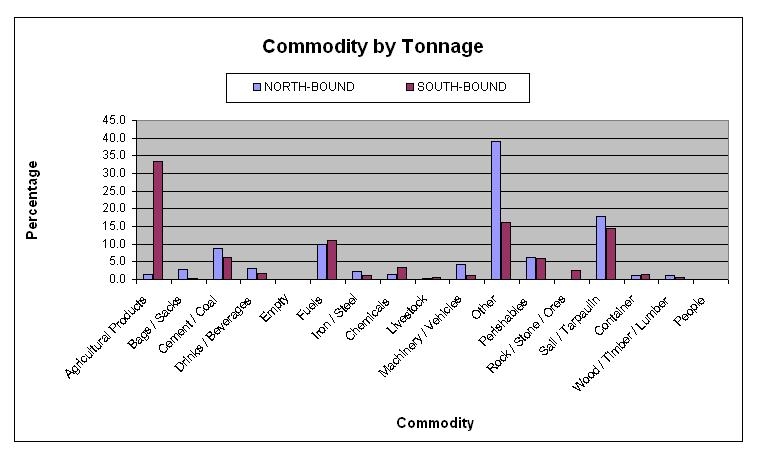
Table 27.4c
|
The commodity analysis showed that about 20% of northbound
and 8% of southbound vehicles were empty. The highest
identifiable commodity observed was fuels and agricultural
products in the southbound direction.
|


