031- Commodity Proportions by Vehicle Numbers and Estimated Tonnage.031-R61-Port Shepstone-Port Edward
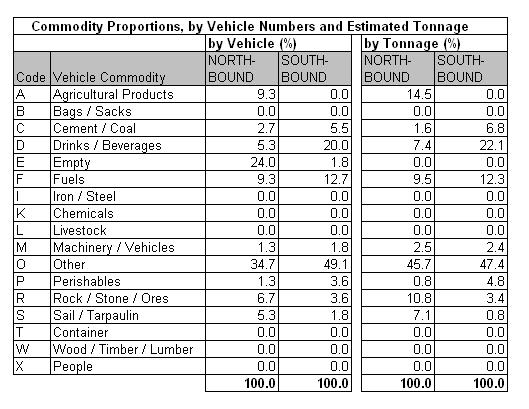
Table 31.4a
|
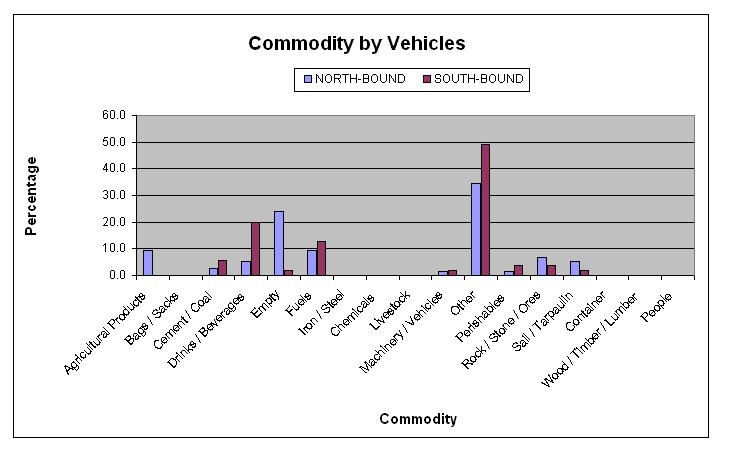
Table 31.4b
|
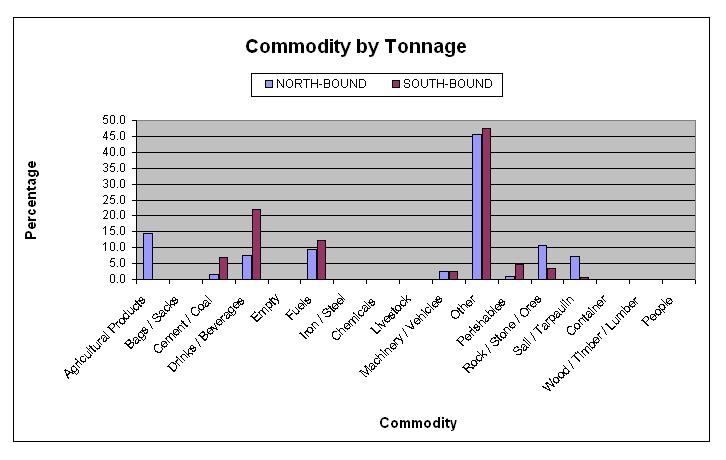
Table 31.4c
|
The commodity analysis showed that about 24% of northbound
and 2% of southbound vehicles were empty. No identifiable
commodity dominates, although fuel and drinks (southbound)
are above average. Unidentified cargo comprising other and
under sail/tarpaulin was 45% of the total.
|


