- - topright (1K)
-
Department of Transport logo KwaZulu-Natal Freight Transport Data Bank KwaZulu_Natal Province logo
Department of Transport collage
line
-
botleft (1K) - botright (1K)
- - topright (1K)
-

Authorities || Cross Border || Roads || Road Freight || Rail Freight || Ports || Pipelines || Airfreight || Intermodal || Industries || Statistics

-
botleft (1K) - botright (1K)
- - topright (1K)
-

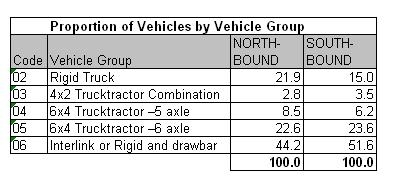
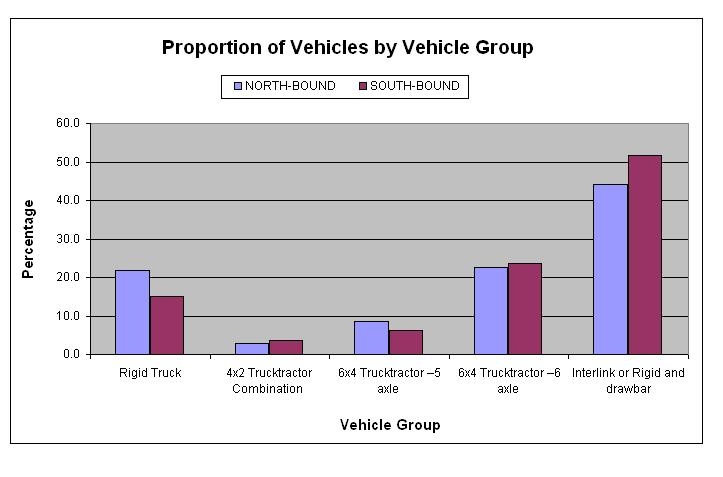
032-Proportions of Vehicles by Vehicle Groups.

032-N2-Empangeni-Mtubatuba

Table 32.1a
Table 32.1a

Table 32.1b
Table 32.1b

Groups 06 and 05 accounts for 71% of the total, indicating largely long distance freight haulage. Groups 04, 03 and 02 accounts for 29% of the total, indicating a proportion of short distance localised freight haulage. A high proportion of LDVs and buses were recorded at this location.

-
botleft (1K) - botright (1K)
- - topright (1K)
-

KwaZulu-Natal Province sub-sites:
arrowKZN Province Home
arrowAuthorities
arrowCross Border
arrowRoads
arrowRoad Freight
arrowRail Freight
arrowPorts
arrowPipelines
arrowAirfreight
arrowIntermodal Freight
arrowIndustries
arrowStatistics

-
botleft (1K) - botright (1K)
- - topright (1K)
-

Admin:
arrowData Bank login

-
botleft (1K) - botright (1K)