032-Commodity Proportions by Vehicle Numbers and Estimated Tonnage.032-N2-Empangeni-Mtubatuba
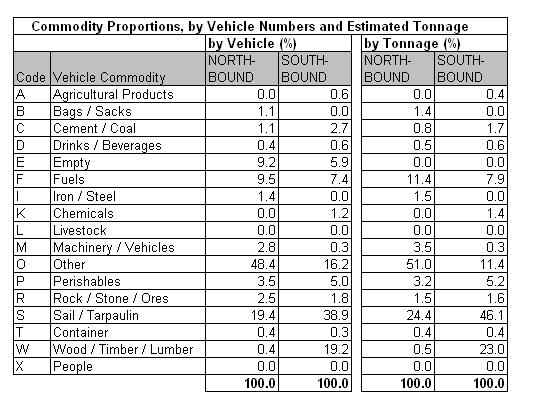
Table 32.4a
|
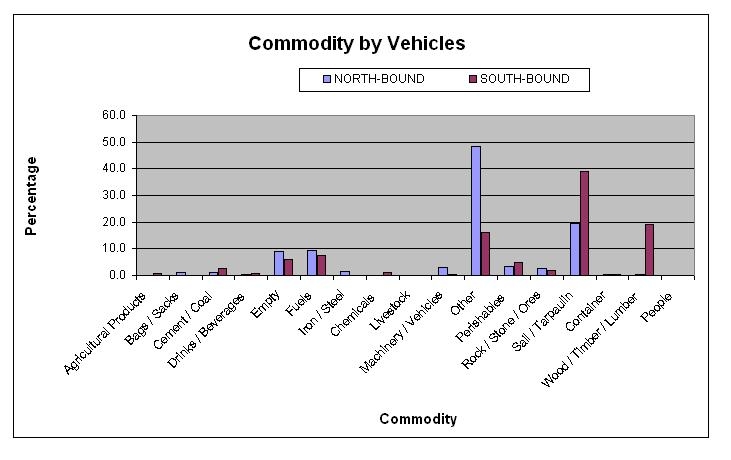
Table 32.4b
|
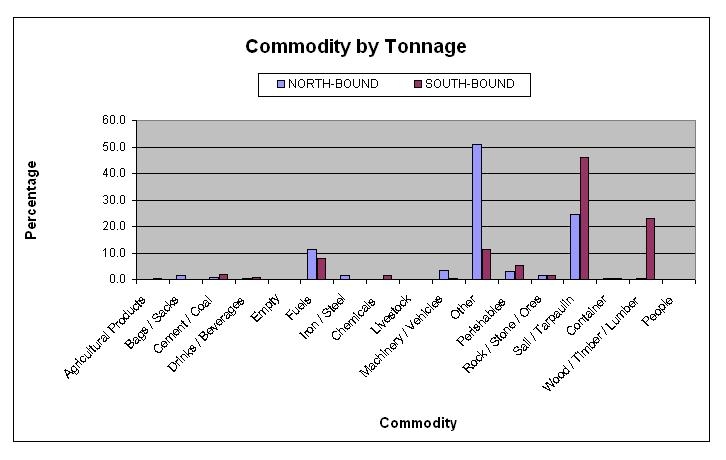
Table 32.4c
|
The commodity analysis showed that about 9% of northbound
and 6% of southbound vehicles were empty. The main
identifiable commodity by vehicle was timber in the
southbound direction. Unidentified cargo comprising other
and under sail/tarpaulin was 61% of the total.
|


