034-Commodity Proportions by Vehicle Numbers and Estimated Tonnage.034-R56-Kokstad-Matatiele
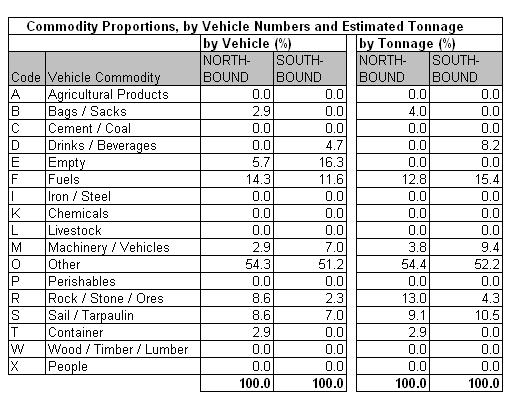
Table 34.4a
|
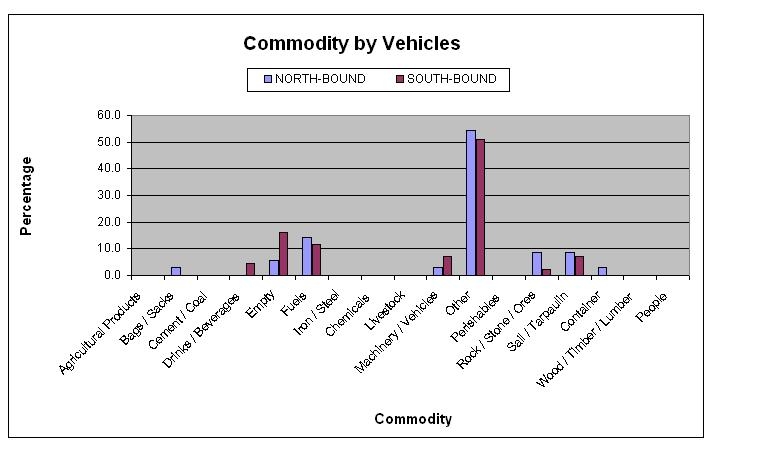
Table 34.4b
|
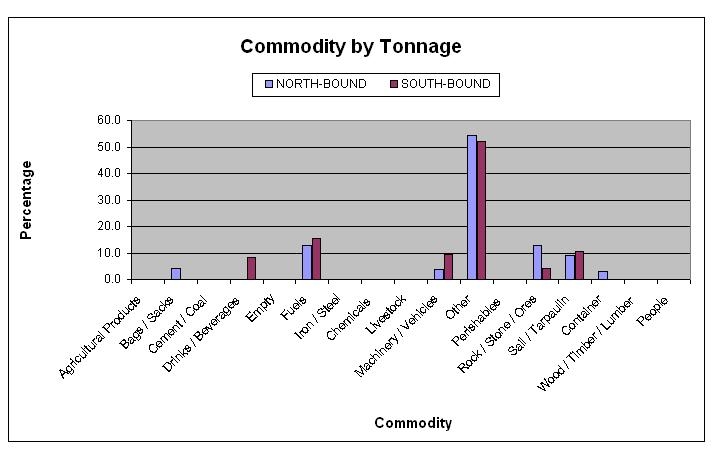
Table 34.4c
|
The commodity analysis showed that about 6% of northbound
and 16% of southbound vehicles were empty. No identifiable
commodity dominates. Unidentified cargo comprising other
and under sail/tarpaulin was 60% of the total.
|


