035- Commodity Proportions by Vehicle Numbers and Estimated Tonnage.035-R617-Kokstad-Underberg
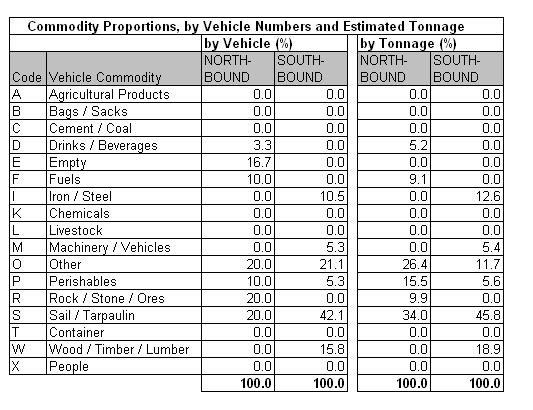
Table 35.4a
|
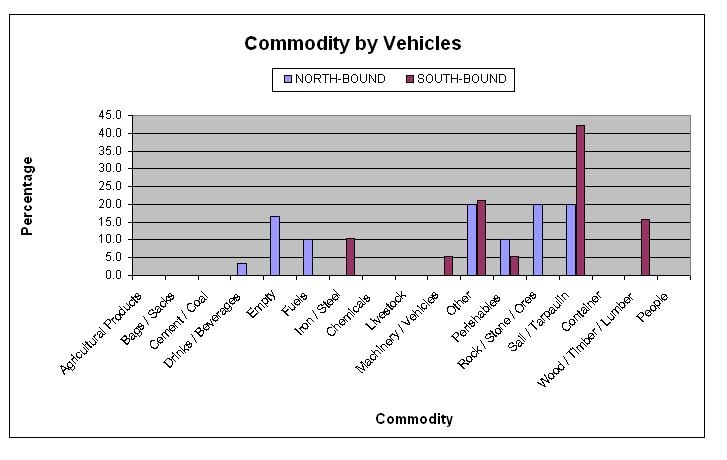
Table 35.4b
|
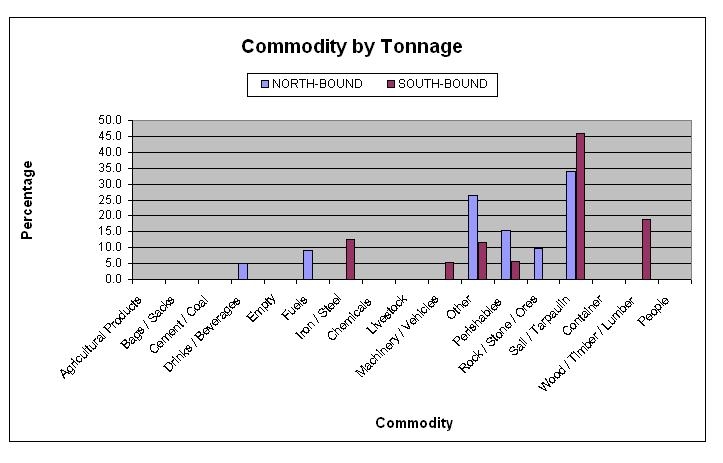
Table 35.4c
|
The commodity analysis showed that about 17% of northbound
and 0% of southbound vehicles were empty. The main
identifiable commodities by vehicle were rock/stone/ore
northbound and timber southbound. Unidentified cargo
comprising other and under sail/tarpaulin totaling 50% of
all vehicles surveyed.
|


