040-Commodity Proportions by Vehicle Numbers and Estimated Tonnage.040-R603-Winkelspruit-Camperdown
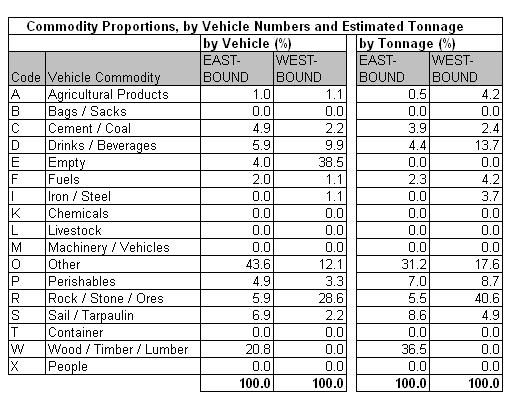
Table 40.4a
|
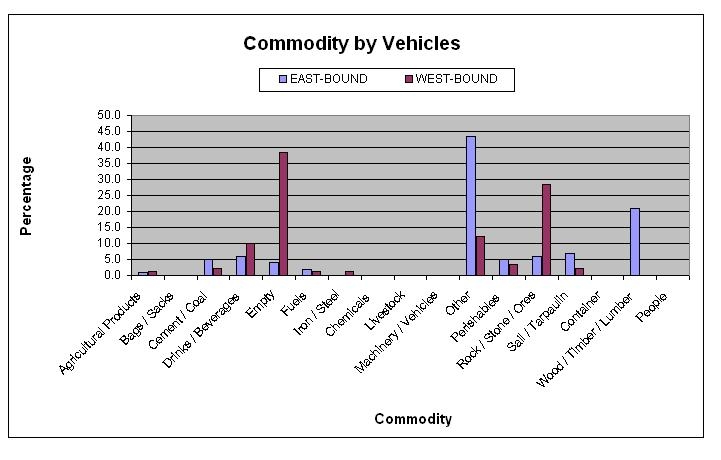
Table 40.4b
|
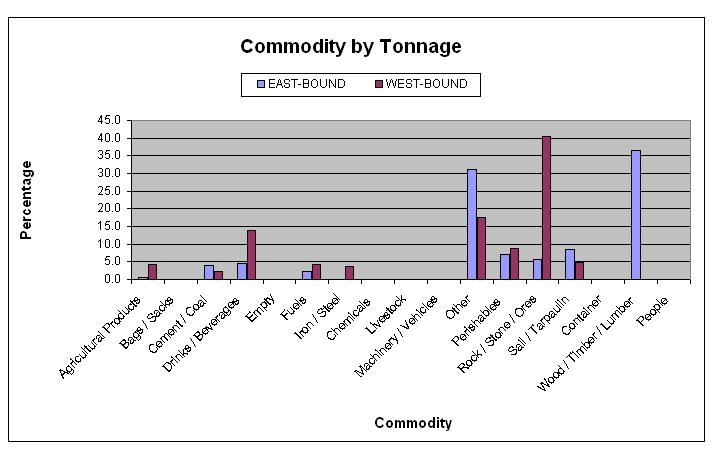
Table 40.4c
|
The commodity analysis showed that about 4% of eastbound
and 39% of westbound vehicles were empty. The main
identifiable commodities by vehicle were timber
(eastbound) and rock/stone/ore (westbound). Unidentified
cargo comprising other (44% eastbound, 12% westbound) and
under sail/tarpaulin (7% eastbound, 2% westbound).
|


