041- Commodity Proportions by Vehicle Numbers and Estimated Tonnage.041-N3-Howick-Mooi-River
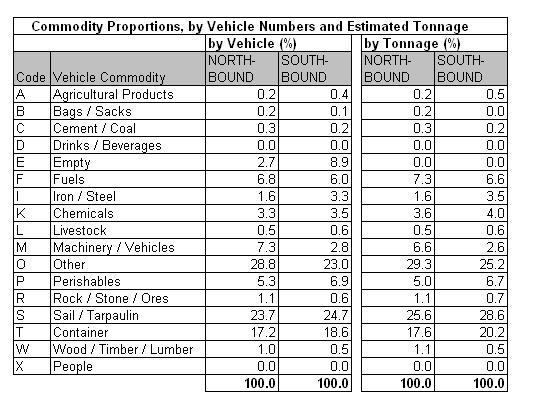
Table 41.4a
|
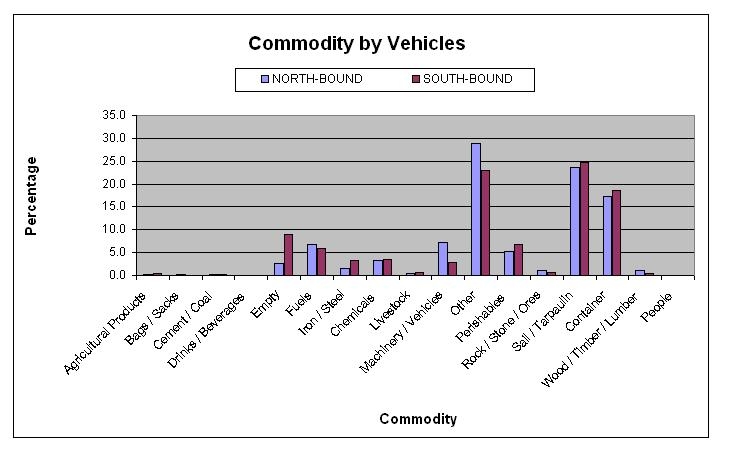
Table 41.4b
|
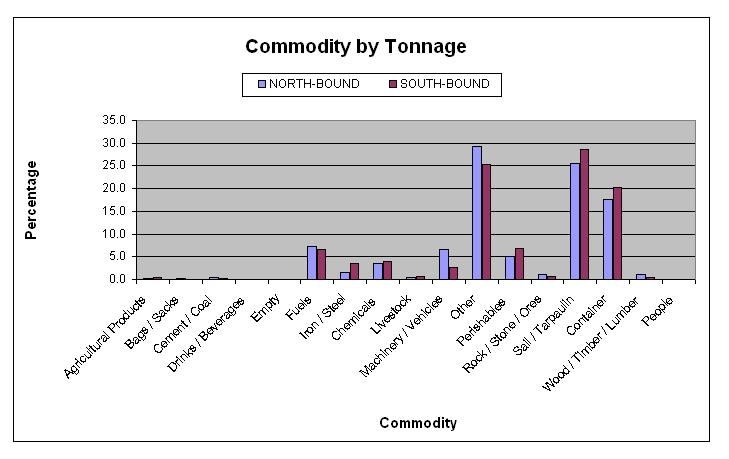
Table 41.4c
|
The commodity analysis showed that about 3% of northbound
and 9% of southbound vehicles were empty. The main
identifiable commodity by vehicle was containers.
Unidentified cargo comprising other and under
sail/tarpaulin totaling 50% of all vehicles surveyed.
|


