042-Commodity Proportions by Vehicle Numbers and Estimated Tonnage.042-N2-Mount Ayliff-Kokstad
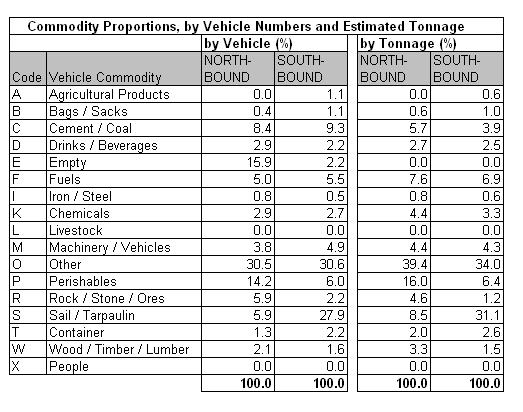
Table 42.4a
|
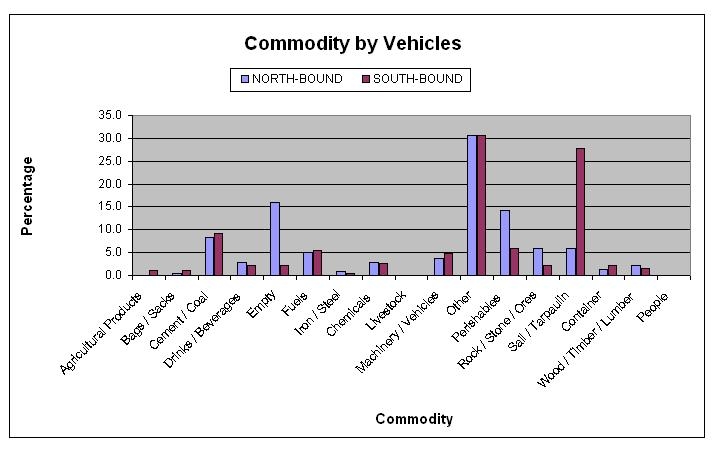
Table 42.4b
|
Table 42.4c
|
The commodity analysis showed that about 164% of
northbound and 2% of southbound vehicles were empty. No
identifiable commodity by vehicle dominates the type of
freight being transported. Unidentified cargo comprising
other (30%) and under sail/tarpaulin (6% northbound, 28%
southbound).
|


