 |
047-Commodity Proportions by Vehicle Numbers and Estimated Tonnage.047-R74-Greytown-Weenen
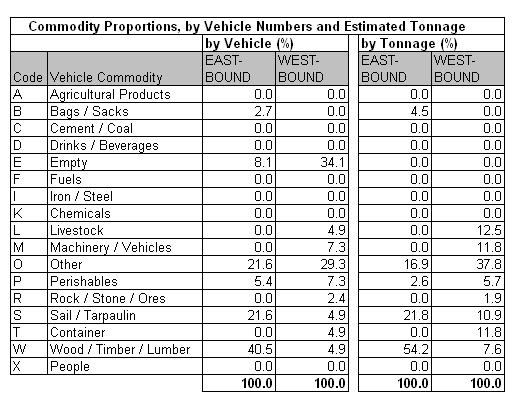
Table 47.4a
|
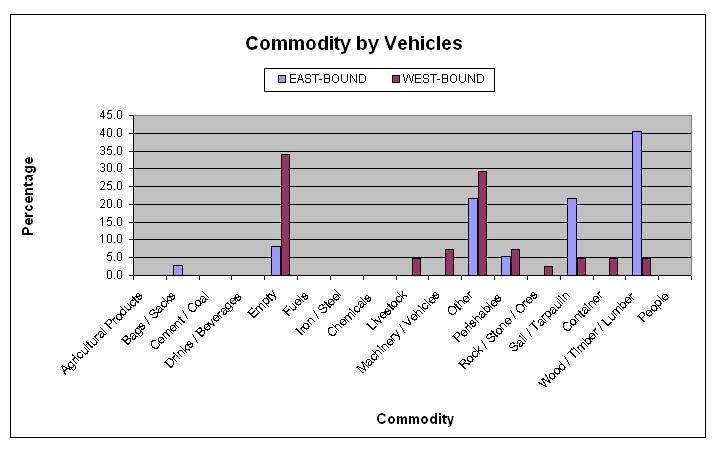
Table 47.4b
|
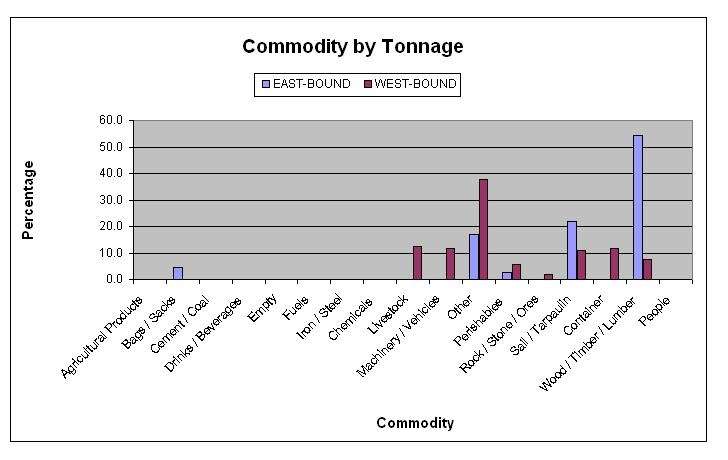
Table 47.4c
|
The commodity analysis showed that about 8% of eastbound
and 34% of westbound vehicles were empty. The main
identifiable commodity was timber in the eastbound
direction. Unidentified cargo comprising other (22%
eastbound, 29% westbound) and under sail/tarpaulin (22%
eastbound, 5% westbound).
|
|


