 |
050-Commodity Proportions by Vehicle Numbers and Estimated Tonnage.050-R68-Melmoth-Nquthu
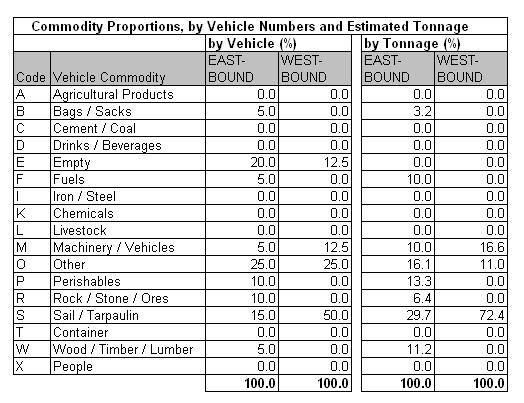
Table 50.4a
|
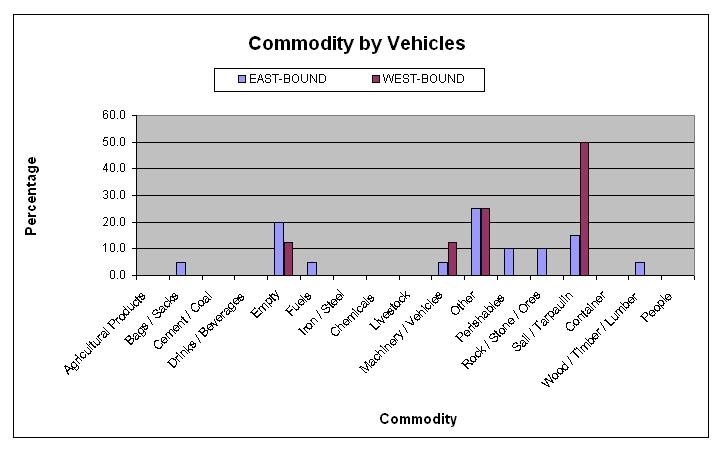
Table 50.4b
|
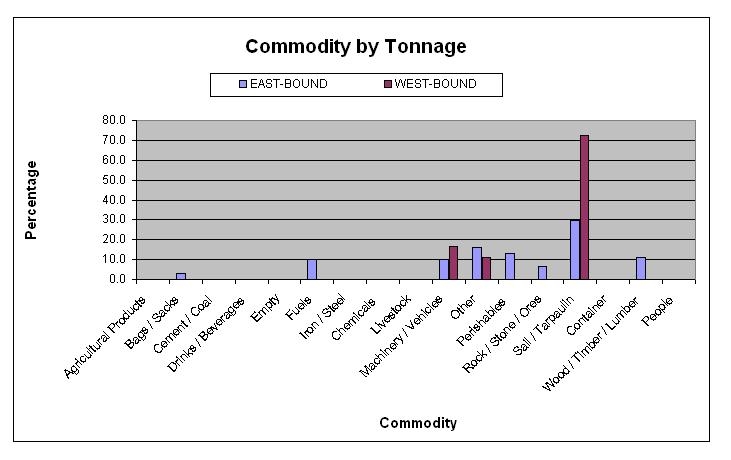
Table 50.4c
|
The commodity analysis showed that about 20% of eastbound
and 13% of westbound vehicles were empty. No identifiable
commodity by vehicle dominates the type of freight being
transported. Unidentified cargo comprising other (25%) and
under sail/tarpaulin (15% eastbound, 50% westbound).
|
|


