 |
051-Commodity Proportions by Vehicle Numbers and Estimated Tonnage.051-R34-Melmoth-Vryheid
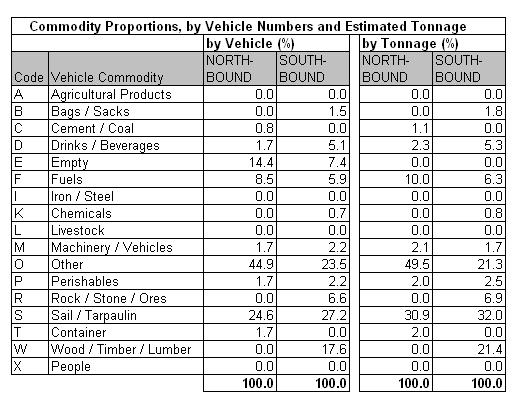
Table 51.4a
|
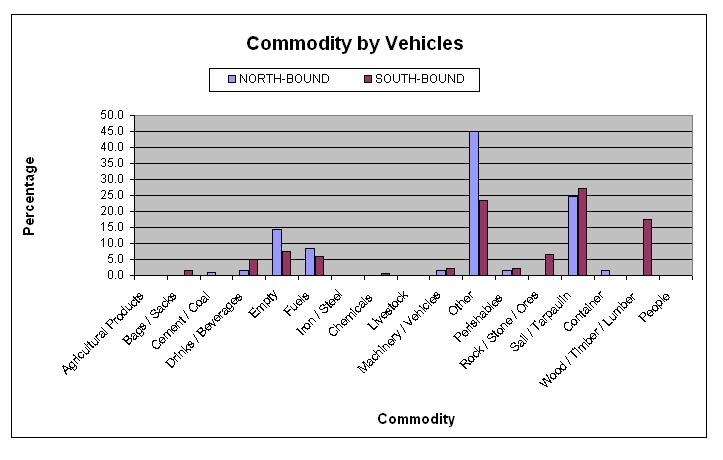
Table 51.4b
|
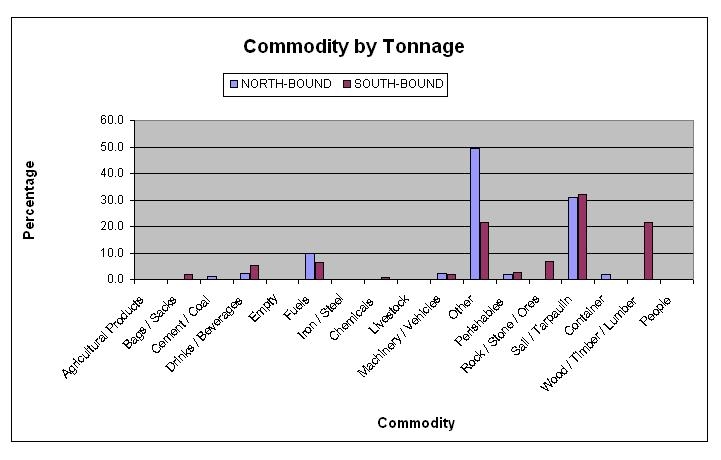
Table 51.4c
|
The commodity analysis showed that about 14% of northbound
and 7% of southbound vehicles were empty. The main
identifiable commodity was timber southbound. Unidentified
cargo comprising other (45% northbound, 24% southbound)
and under sail/tarpaulin (27%).
|
|


