054-Commodity Proportions by Vehicle Numbers and Estimated Tonnage.054-R69-Vryheid-Louwsburg
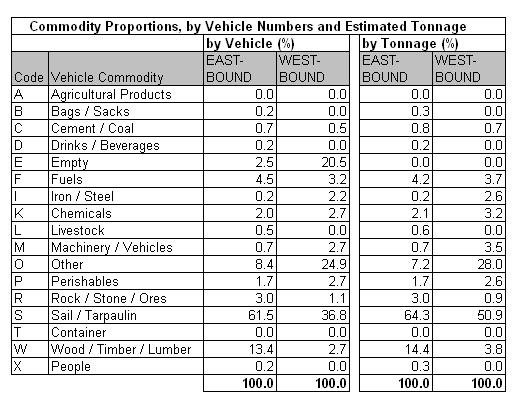
Table 54.4a
|
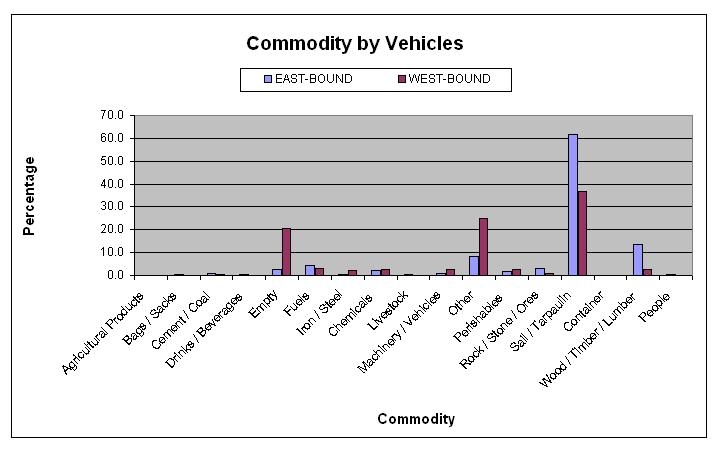
Table 54.4b
|
Table 54.4c
|
The commodity analysis showed that about 3% of eastbound
and 21% of westbound vehicles were empty. No identifiable
commodity by vehicle dominates the type of freight being
transported. Unidentified cargo comprising other and under
sail/tarpaulin totaling 66% of all vehicles surveyed.
|


