055-Commodity Proportions by Vehicle Numbers and Estimated Tonnage.055-N2-Piet Retief-Pongola

Table 55.4a
|
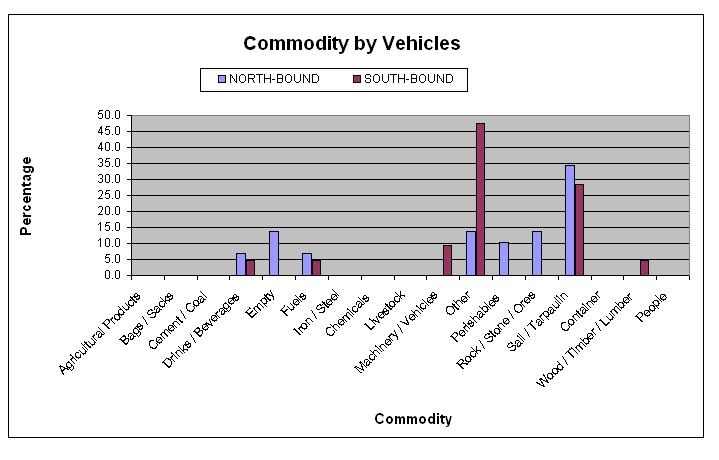
Table 55.4b
|
Table 55.4c
|
The commodity analysis showed that about 13% of northbound
and 0% of southbound vehicles were empty. No identifiable
commodity by vehicle dominates the type of freight being
transported.
|


